[Video] Monitoring Kubernetes and Cloud-Native Applications with Zabbix
Welcome to the first in a series of videos showing how to monitor Kubernetes (and cloud-native applications) with Zabbix. Throughout the series, we will review key topics, including:
- How to install the necessary components to monitor a cluster with Zabbix
- Understanding the metrics generated within Zabbix
- Exploiting the Prometheus endpoints exposed by applications to monitor application-specific metrics
Why would you monitor Kubernetes with Zabbix?
First, you may wonder why you’d want to use Zabbix as a monitoring tool instead of Prometheus, Grafana, or Alertmanager. After all, these products have become standard monitoring tools in the cloud ecosystem. But with Zabbix being such a widely-adopted monitoring tool for traditional infrastructure, we couldn’t overlook how adding Kubernetes and cloud-native applications could be incredibly powerful. Through our vetting process, we found that Zabbix is a surprisingly strong contender in this space, made better because many enterprises already have Zabbix deployed in their data centers today.
As a sneak peek, here are some of the highlights we found with Zabbix as a Kubernetes monitoring tool:
- Since it uses the same backend tools, Zabbix provides metrics and triggers like Prometheus, Alertmanager, and Grafana for Kubernetes.
- Zabbix does the job in one product while maintaining flexibility and monitoring pretty much anything you can write code to collect.
- Zabbix can transform Prometheus metrics fed to it by Prometheus exporters and endpoints. Because Zabbix can make calls to any HTTP endpoint, it can also monitor applications that do not have a dedicated Prometheus endpoint, unlike Prometheus.
So, let’s dive into the first video…
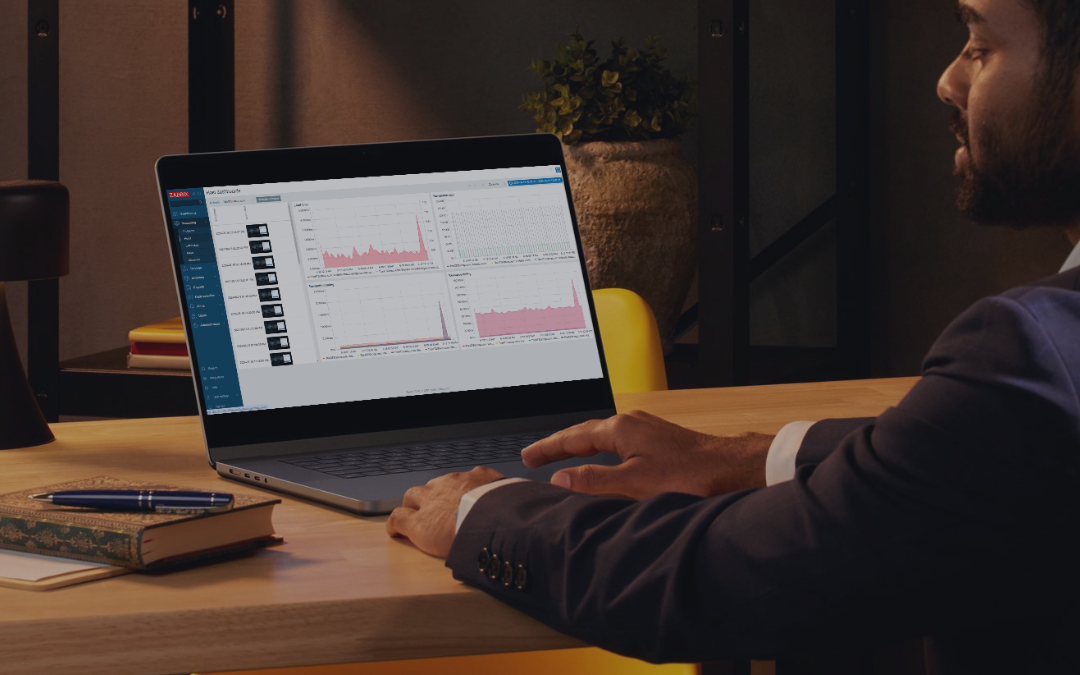
Monitoring your Kubernetes clusters in Zabbix
You should now be all set to start monitoring your Kubernetes clusters in Zabbix! Give it a try, and let us know your thoughts in the comments.
In the next video, we will look at what you can do with your newly monitored cluster and how to get the most out of it.
If you’d like help with any of this, ATS has advanced monitoring, orchestration, and automation skills to make this process a snap. Let’s grab 15 minutes to go through any questions you have.


