")
Zabbix 7.0 LTS was released this month and brought with it a plethora of exciting new features. One of the most eagerly anticipated features is the Zabbix Browser Item, which harnesses the power of Selenium. The integration of Web Drivers into Zabbix’s already robust set of features opens up new possibilities for enterprise-level monitoring.
This article will examine the intricacies of the Browser Item, how it works, and its practical applications in enterprise-level monitoring. Let’s dive in.
What is a Zabbix Browser Item?
To understand the utility of the new Browser Item and begin the exercise, it is essential to comprehend what it is and how it works. Zabbix utilizes a combination of Duktape, a lightweight JavaScript engine, and Selenium, a Web Driver used to automate tasks in the browser. Selenium simulates user interactions with webpage elements, while the Browser Item interfaces with Duktape to efficiently collect performance data from the browser during these simulated user actions.
Zabbix administrators can leverage the Browser Item in JavaScript programs to simulate systems and gather metric data about their execution.
What We Will Monitor in This Exercise
The contact form on the Zabbix info page is a critical system on the ATS website that can be easily monitored using this new feature. If customers are unable to contact us for services, both parties will miss opportunities.
How does Zabbix implement Browser Items?
Setting up the Selenium Server
A guide for a containerized approach to running the Selenium Server can be found here.
The Steps to Set up Zabbix Browser Monitoring:
As this is a brand-new feature and best practices are yet to be established, a sensible approach is to treat each site as a new host that receives a cloned and edited version of the “Website by Browser” Template included in the Zabbix 7.0 release. The simplest method to monitor all the standard metric data included in the new feature is to clone this template and utilize the accompanying dashboard. All data is collected in the “Get data” Browser Item and is parsed and presented with each Dependent Item in the Template. The JavaScript executed by Zabbix is found in the Script value of the Browser Item’s Item view, which needs to be edited to control the browser and simulate an end user submitting the contact form.
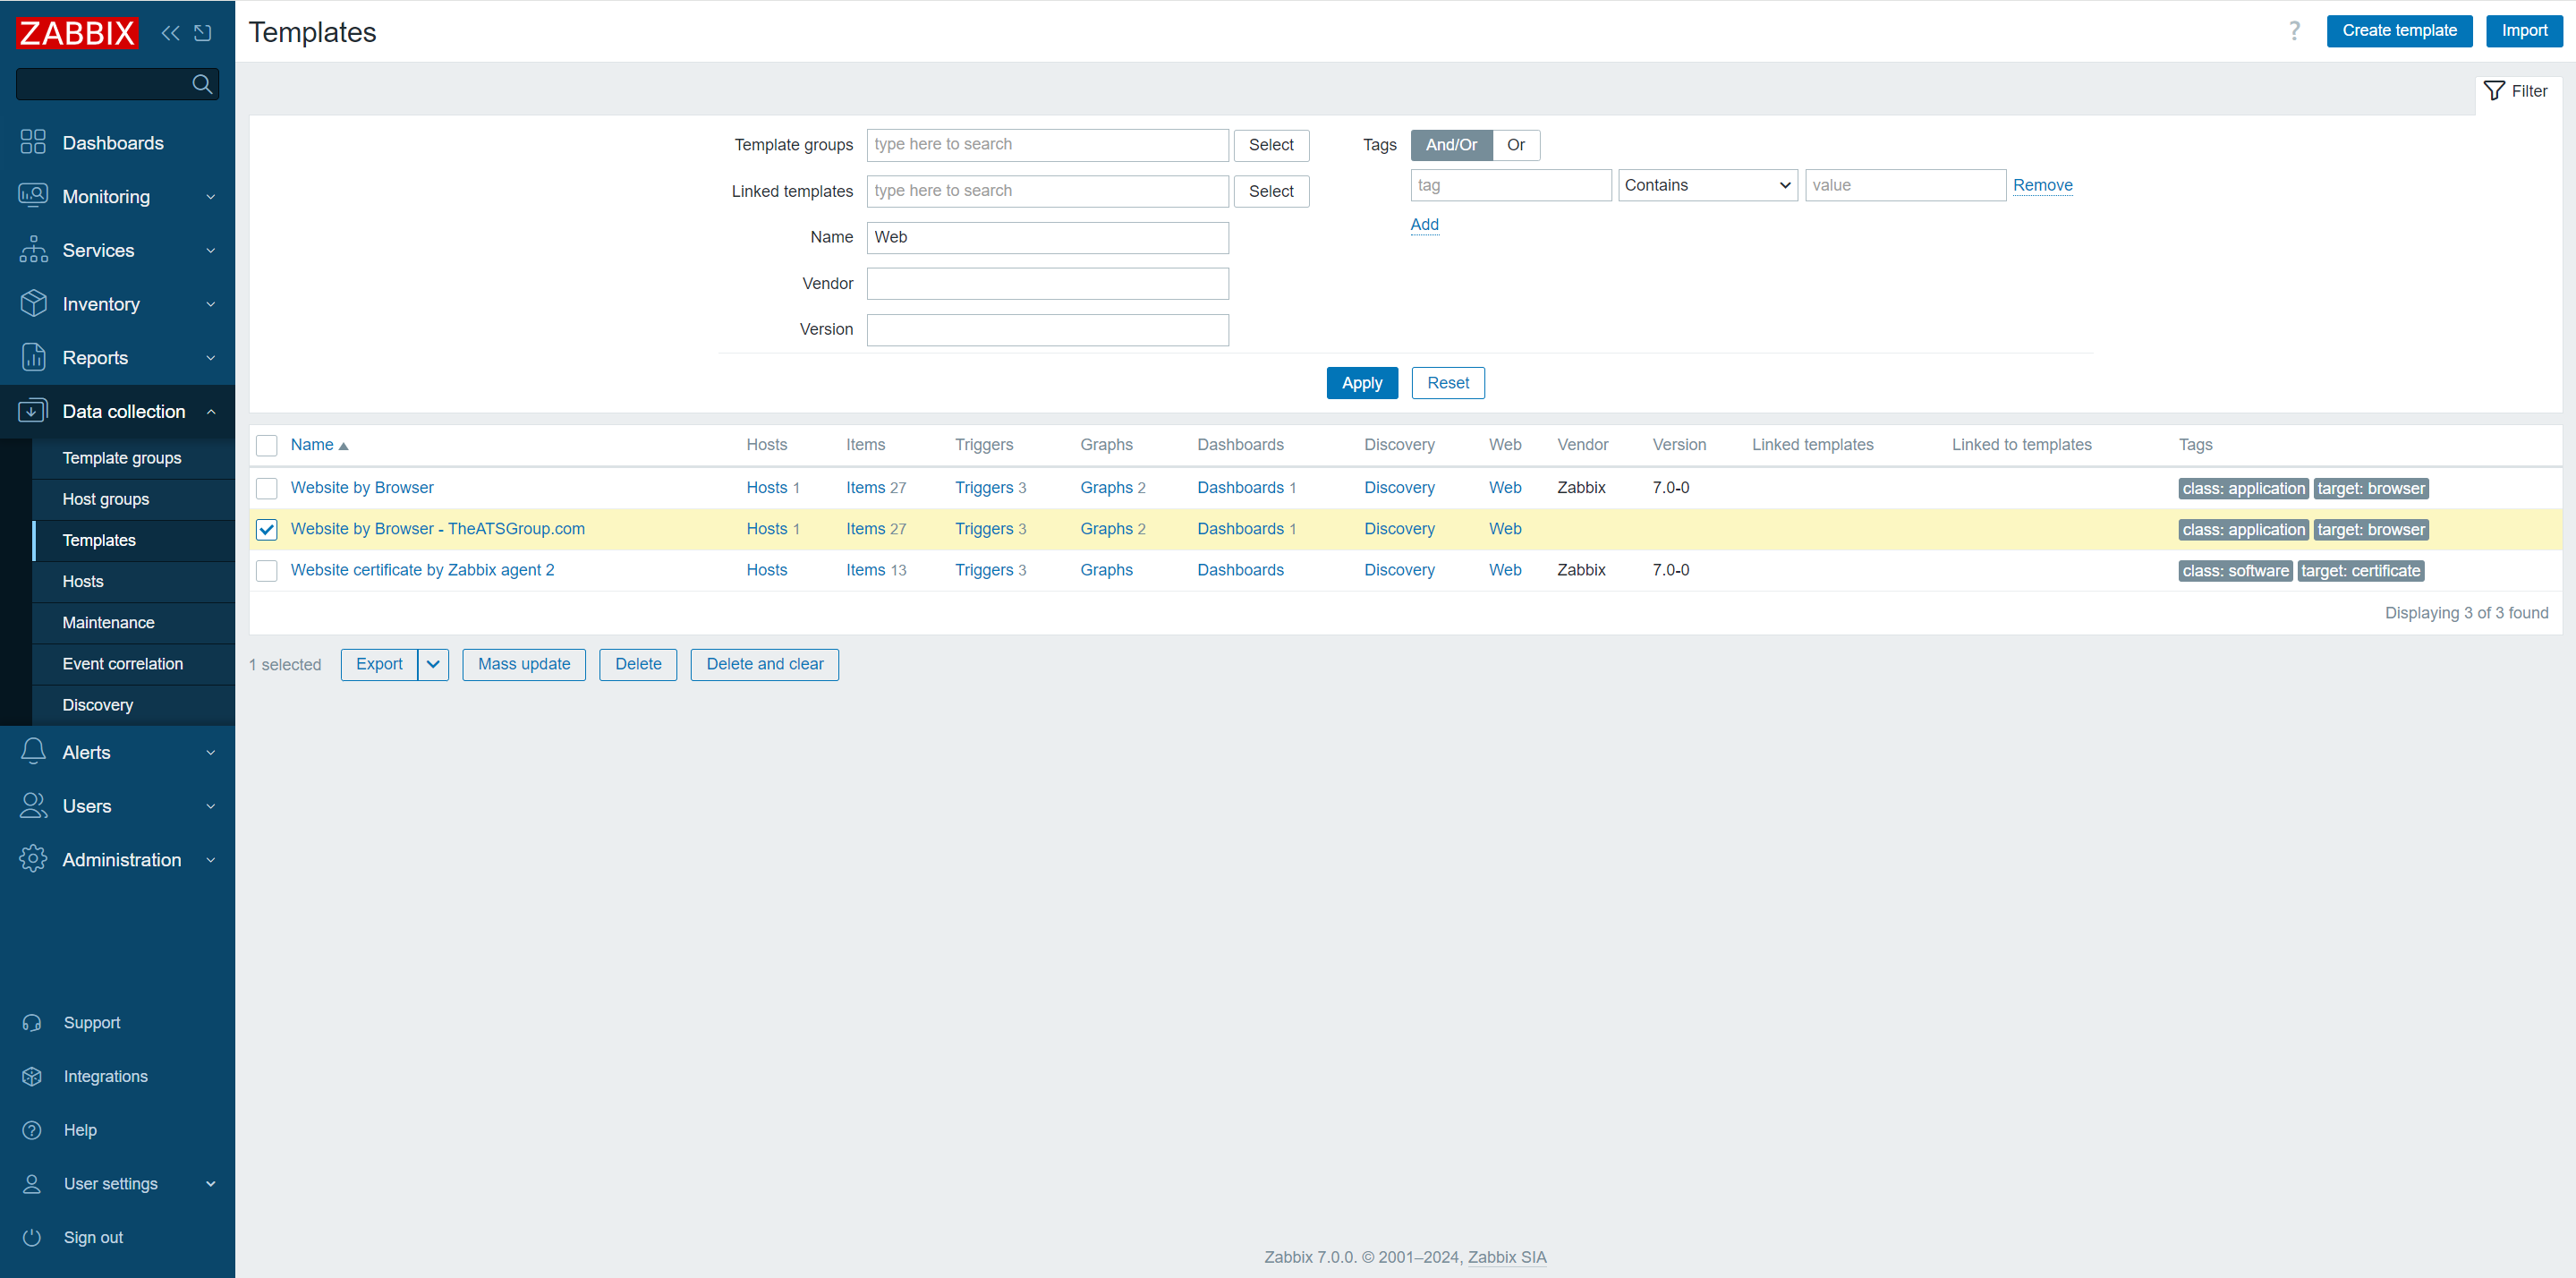
- Step 1 – Clone the Website by Browser Template
- Navigate to the “Data Collection” menu
- Click on “Templates”
- Search for “Web”
- Click on “Website by Browser,” then select the “Clone” option
- Enter a new name for the cloned Template and click “Add”
- Step 2 – Edit the Cloned Template for the system you will monitor
- Click on the new template
- Click the “Macros” option from the top of the template view
- Replace “example.com” with the site to be monitored under “{$WEBSITE.DOMAIN}”
- Click “Update” and then the link to “Items” associated with the new template
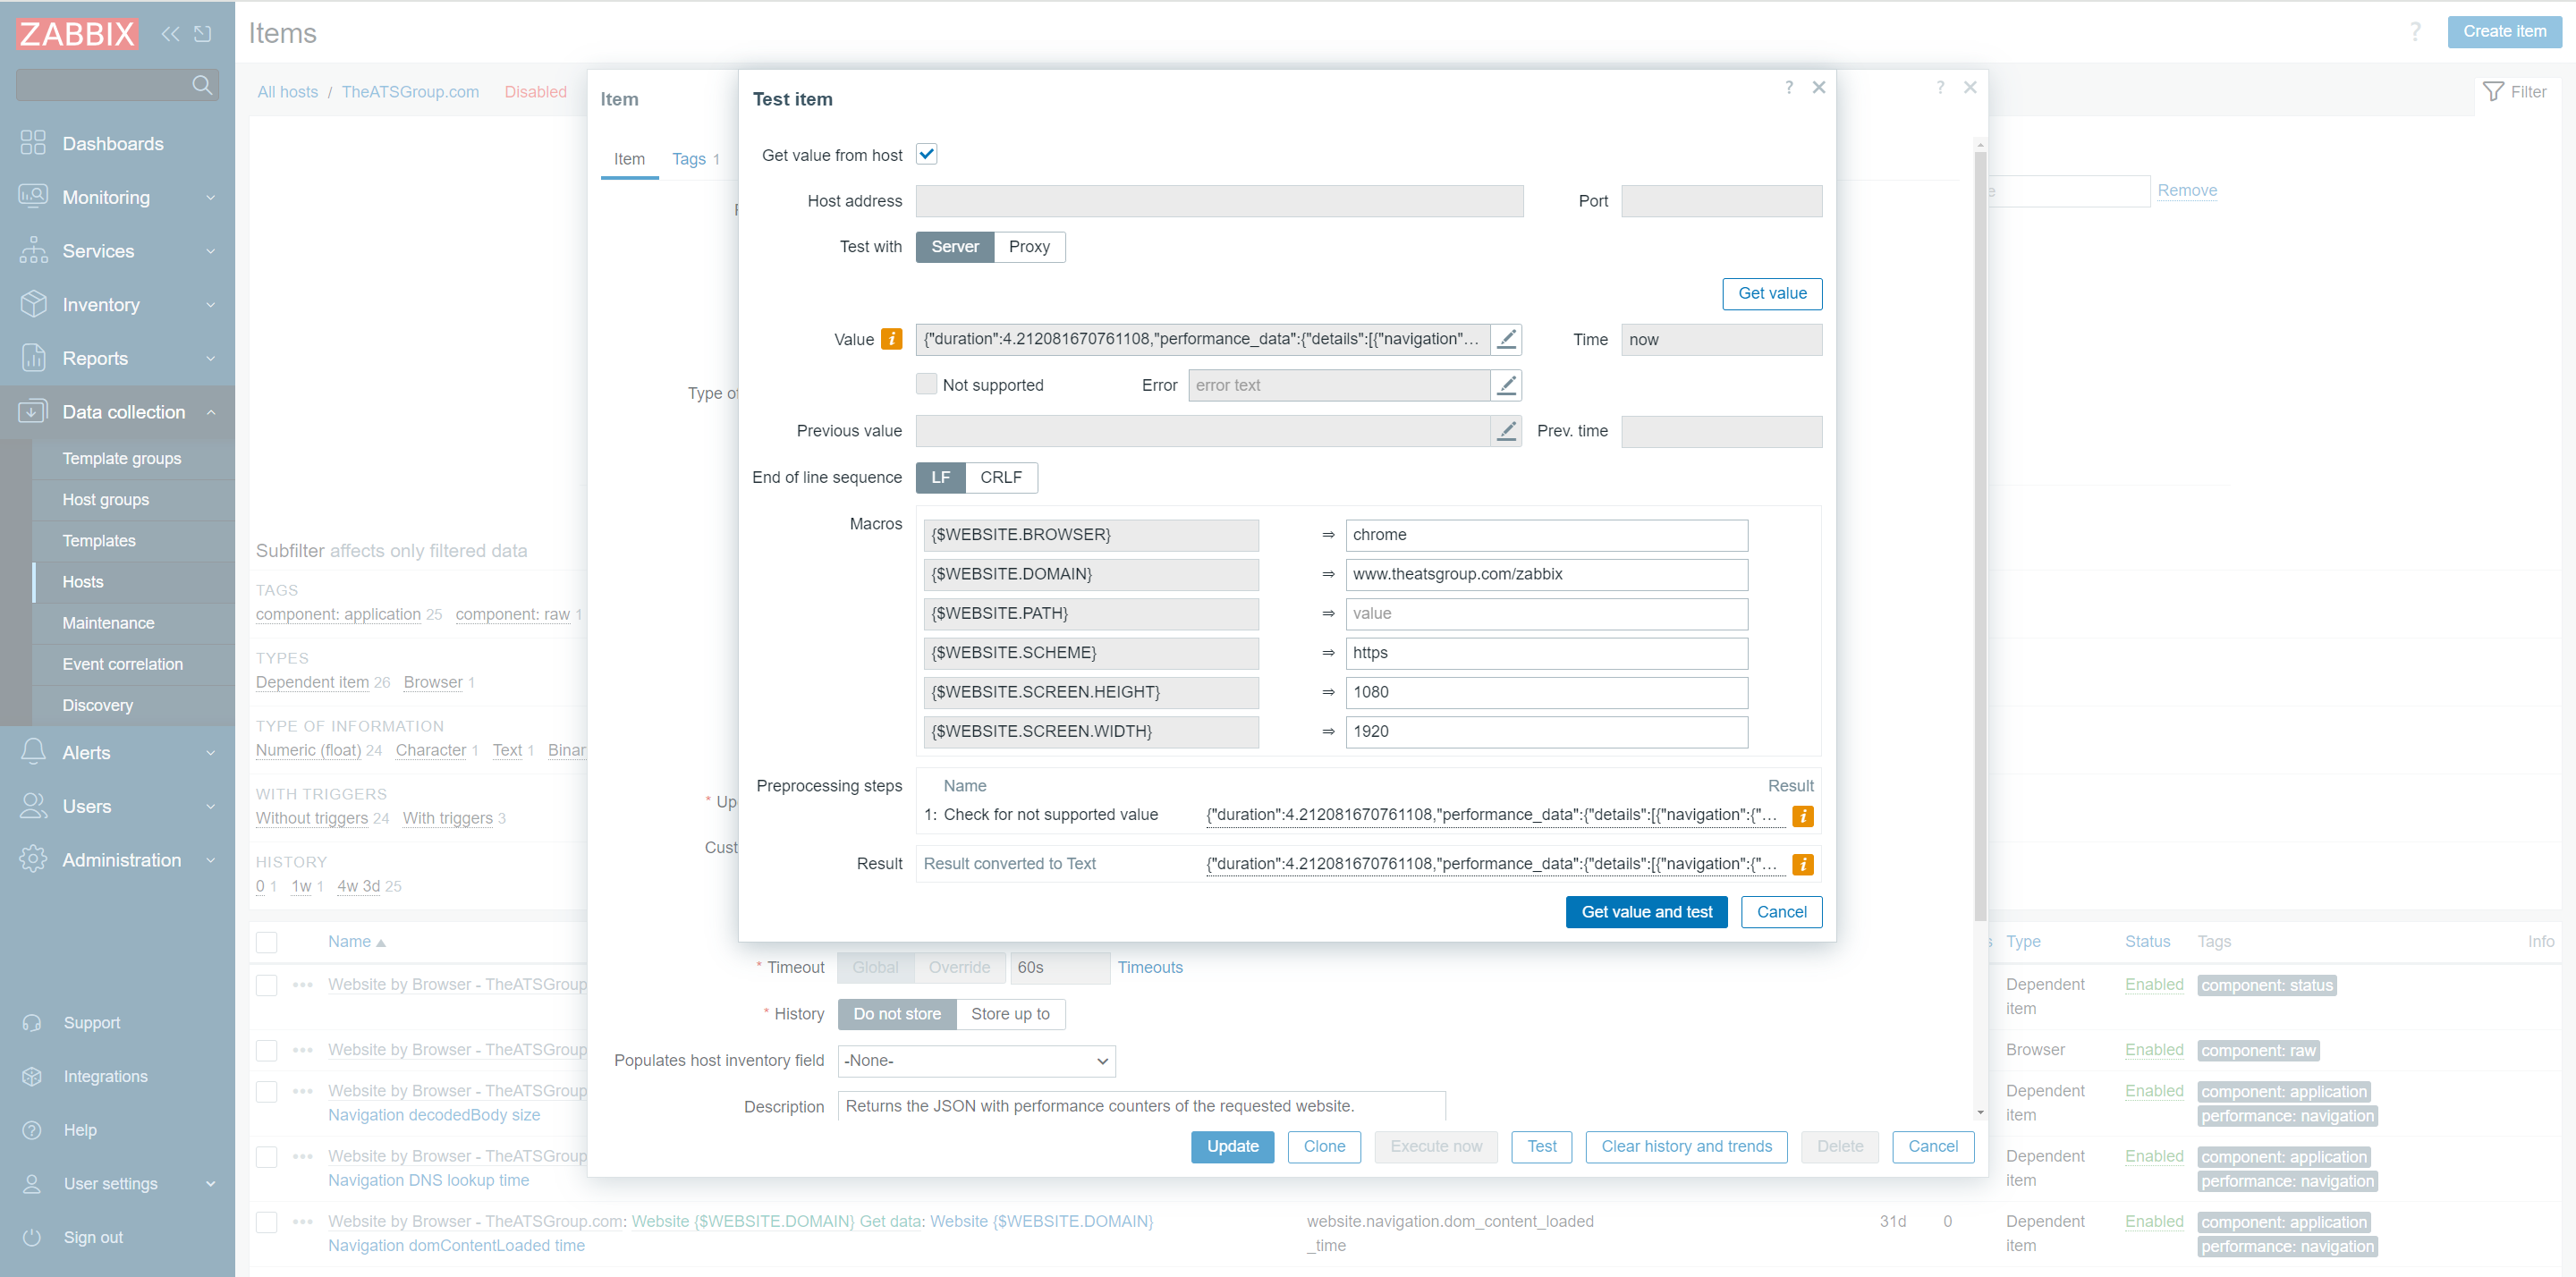
- Click on the Name of the “website.get.dataWebsite {$WEBSITE.DOMAIN} Get data” item
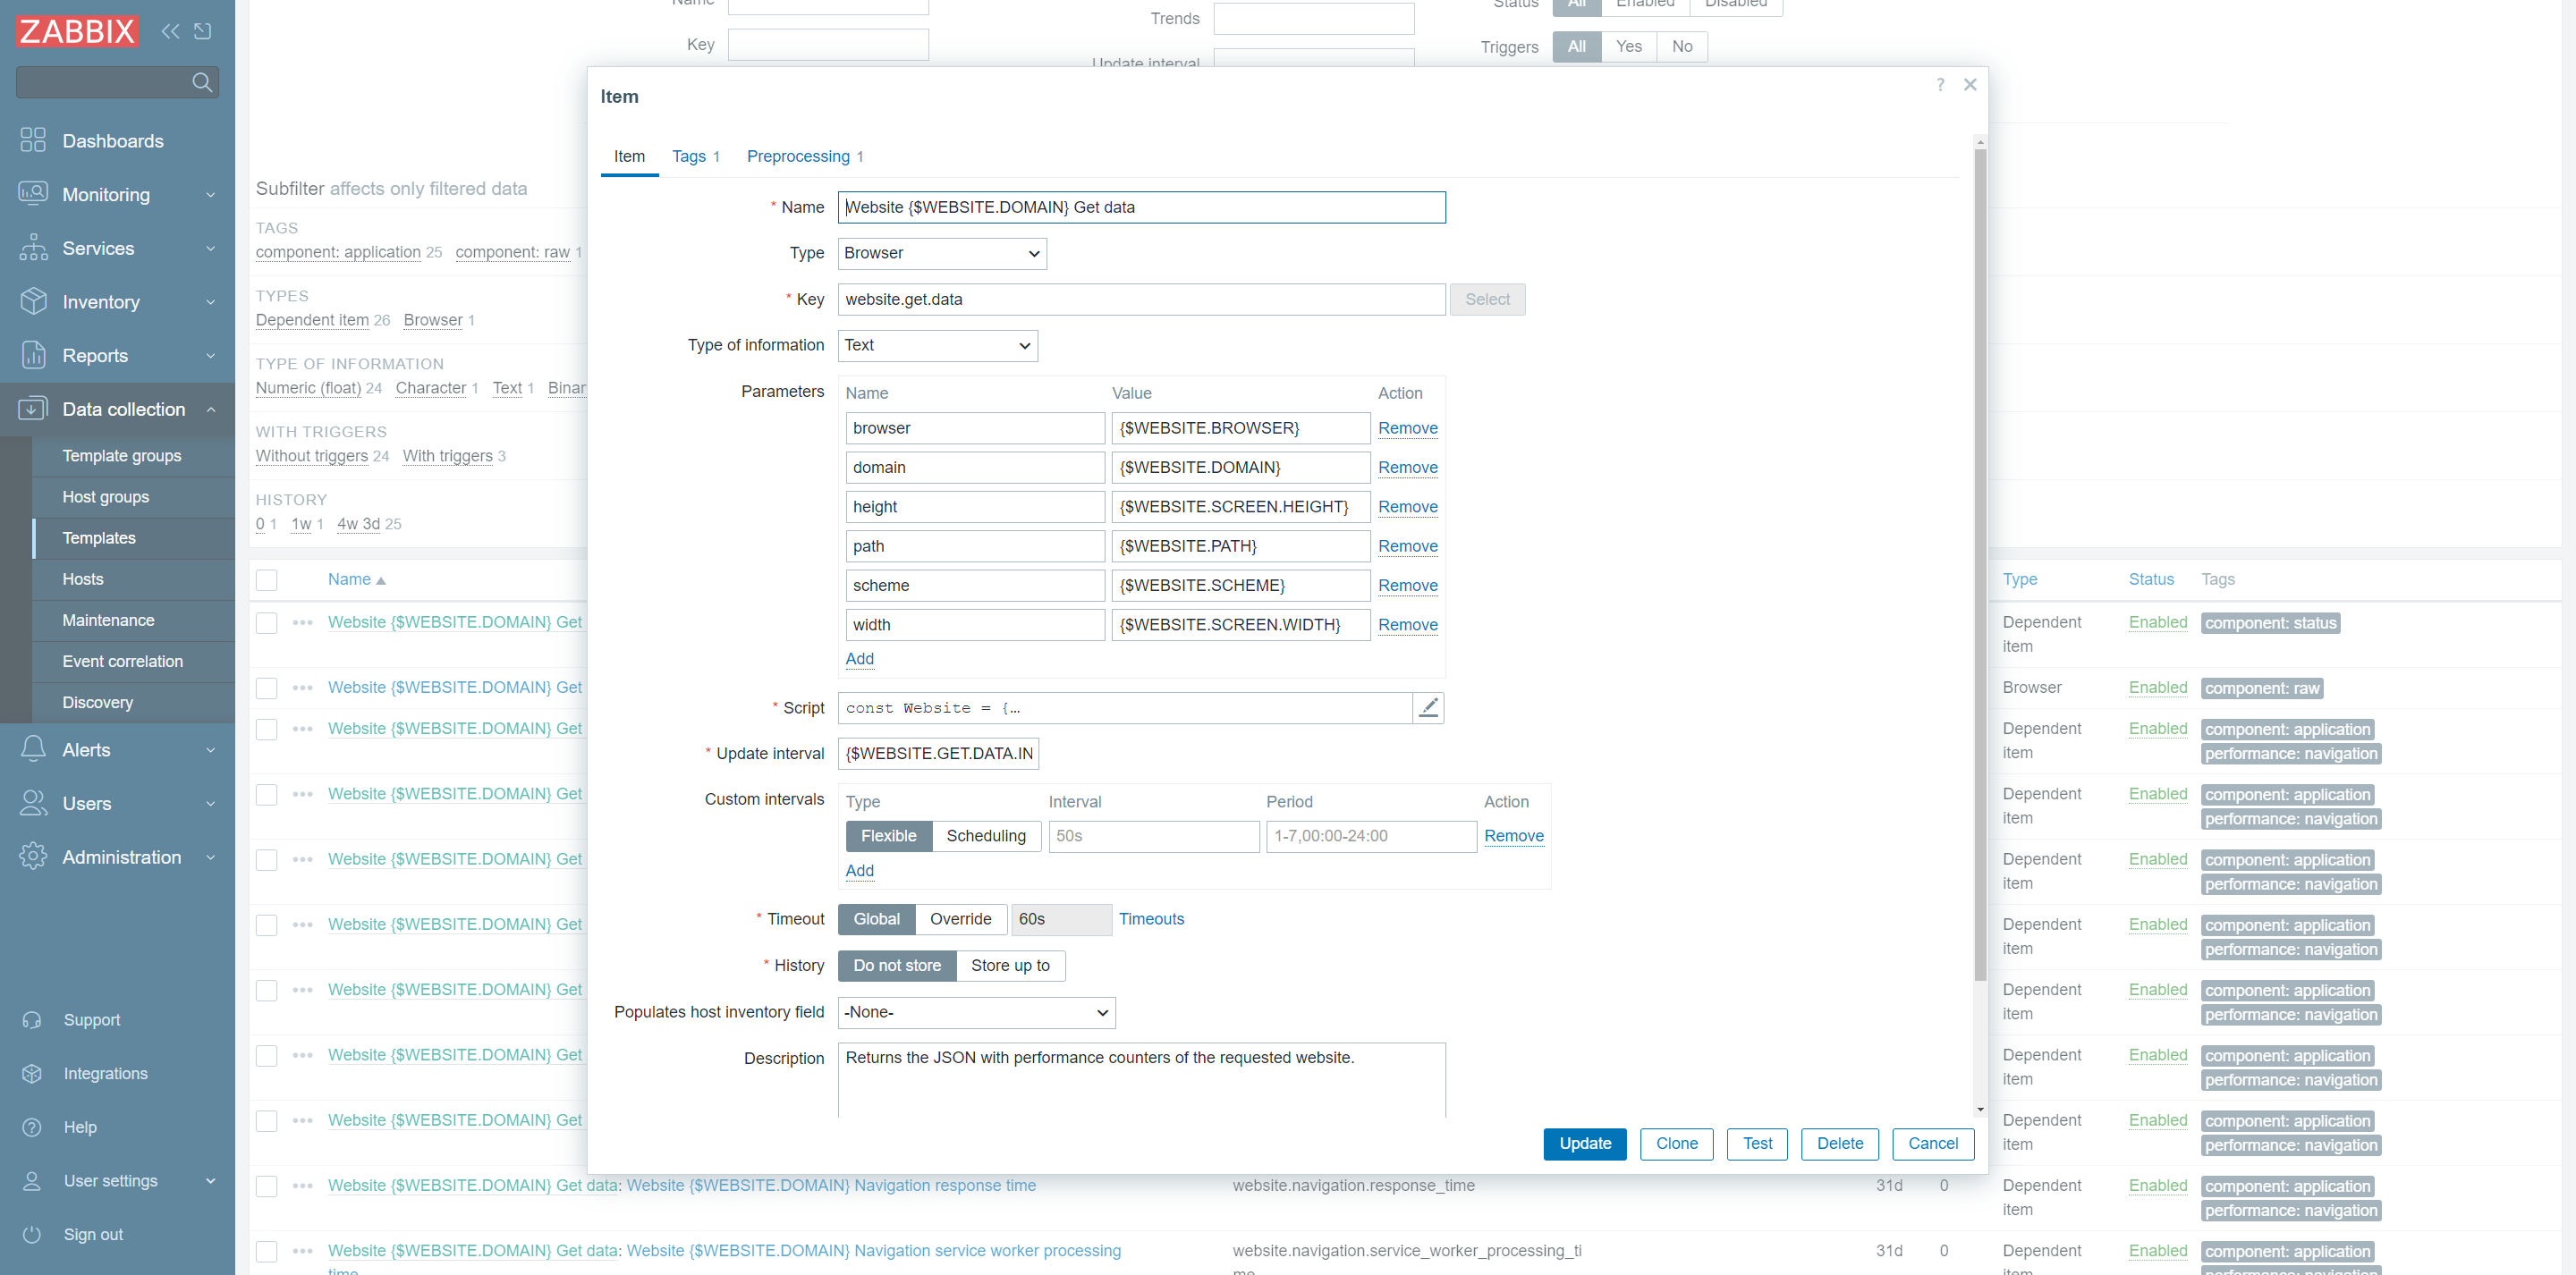
- Click on the pencil-in-a-box symbol to edit the Selenium script
- Edit the default script under the “getPerformance” function and click “Apply”
- See Simulating the End User for details on the changes made to “getPerformance”
- Test the edited script to ensure it’s working before leaving the Template
- Click “Test” in the bottom right, then “Get value and test”
- The test should complete with no errors
A warning about truncated data is normal and related to the test - Exit the test by clicking “Cancel,” then click “Update”
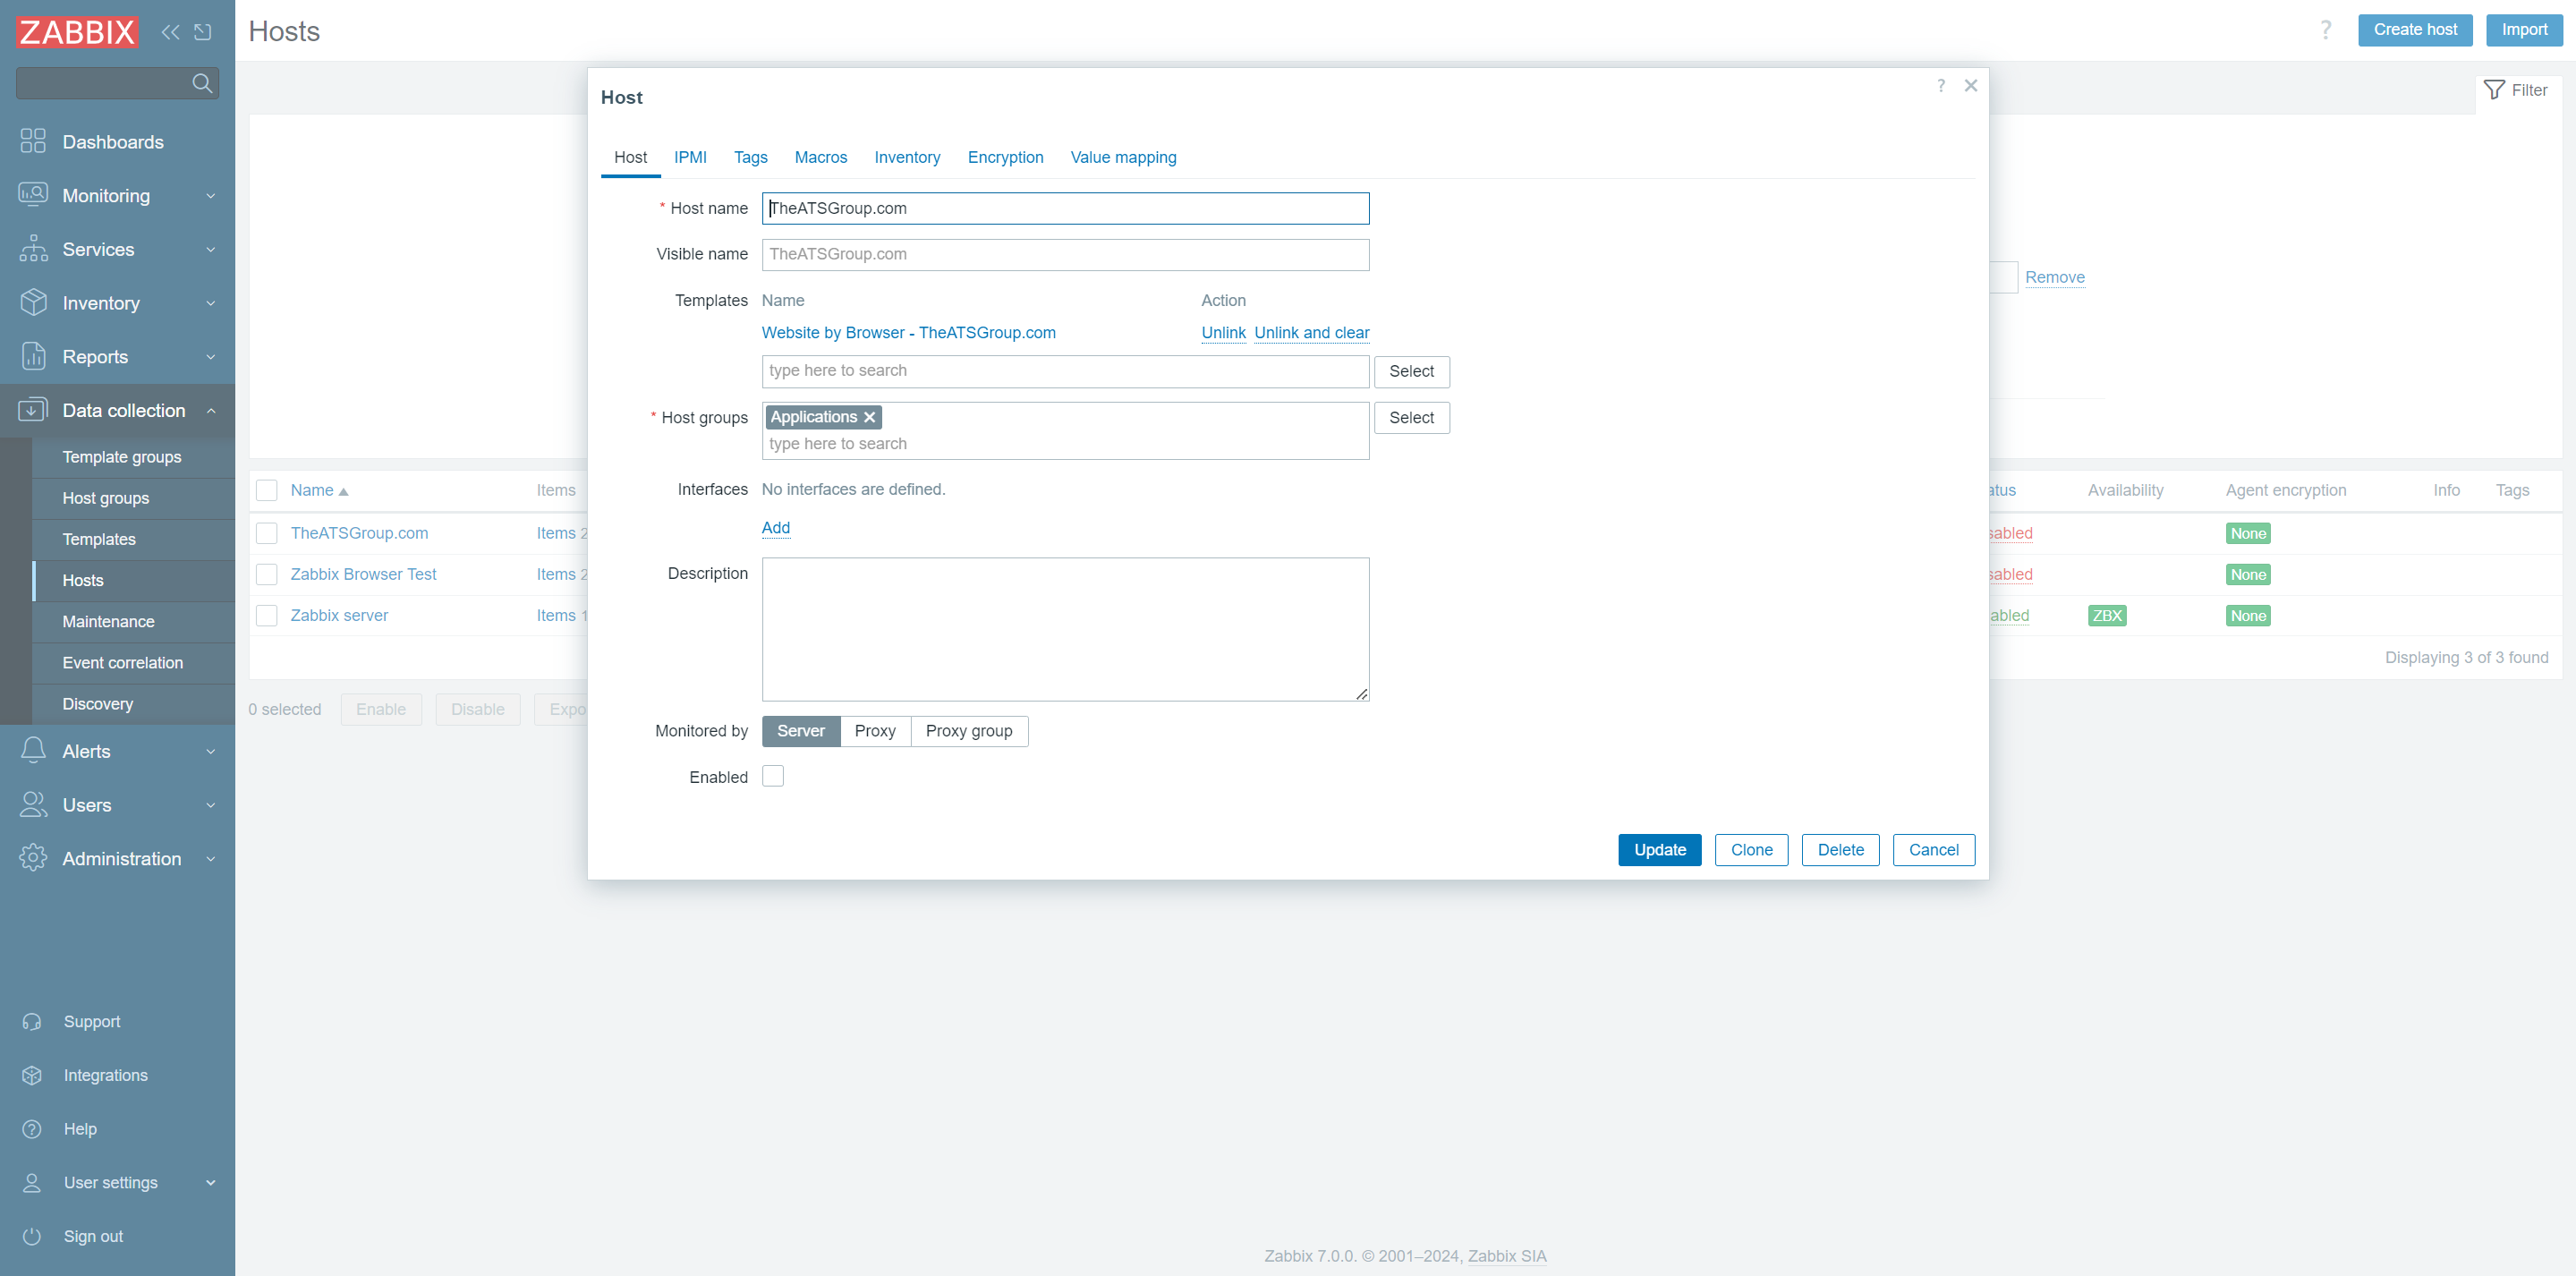
- Step 3 – Add the Template to a new Host
- Navigate to “Hosts” from the list of options under the “Data collection” menu
- Click “Create host” in the upper right corner of the screen
- Give the new host a name that corresponds to the Template created previously
- Add the created Template and the “Applications” Host Group
- Click “Add” in the bottom right
- Step 4 – Test the Browser Item and its Dashboard
- Click on the “Items” for the new host, then select all Items in the list
- Scroll to the bottom of the page and click “Execute now”
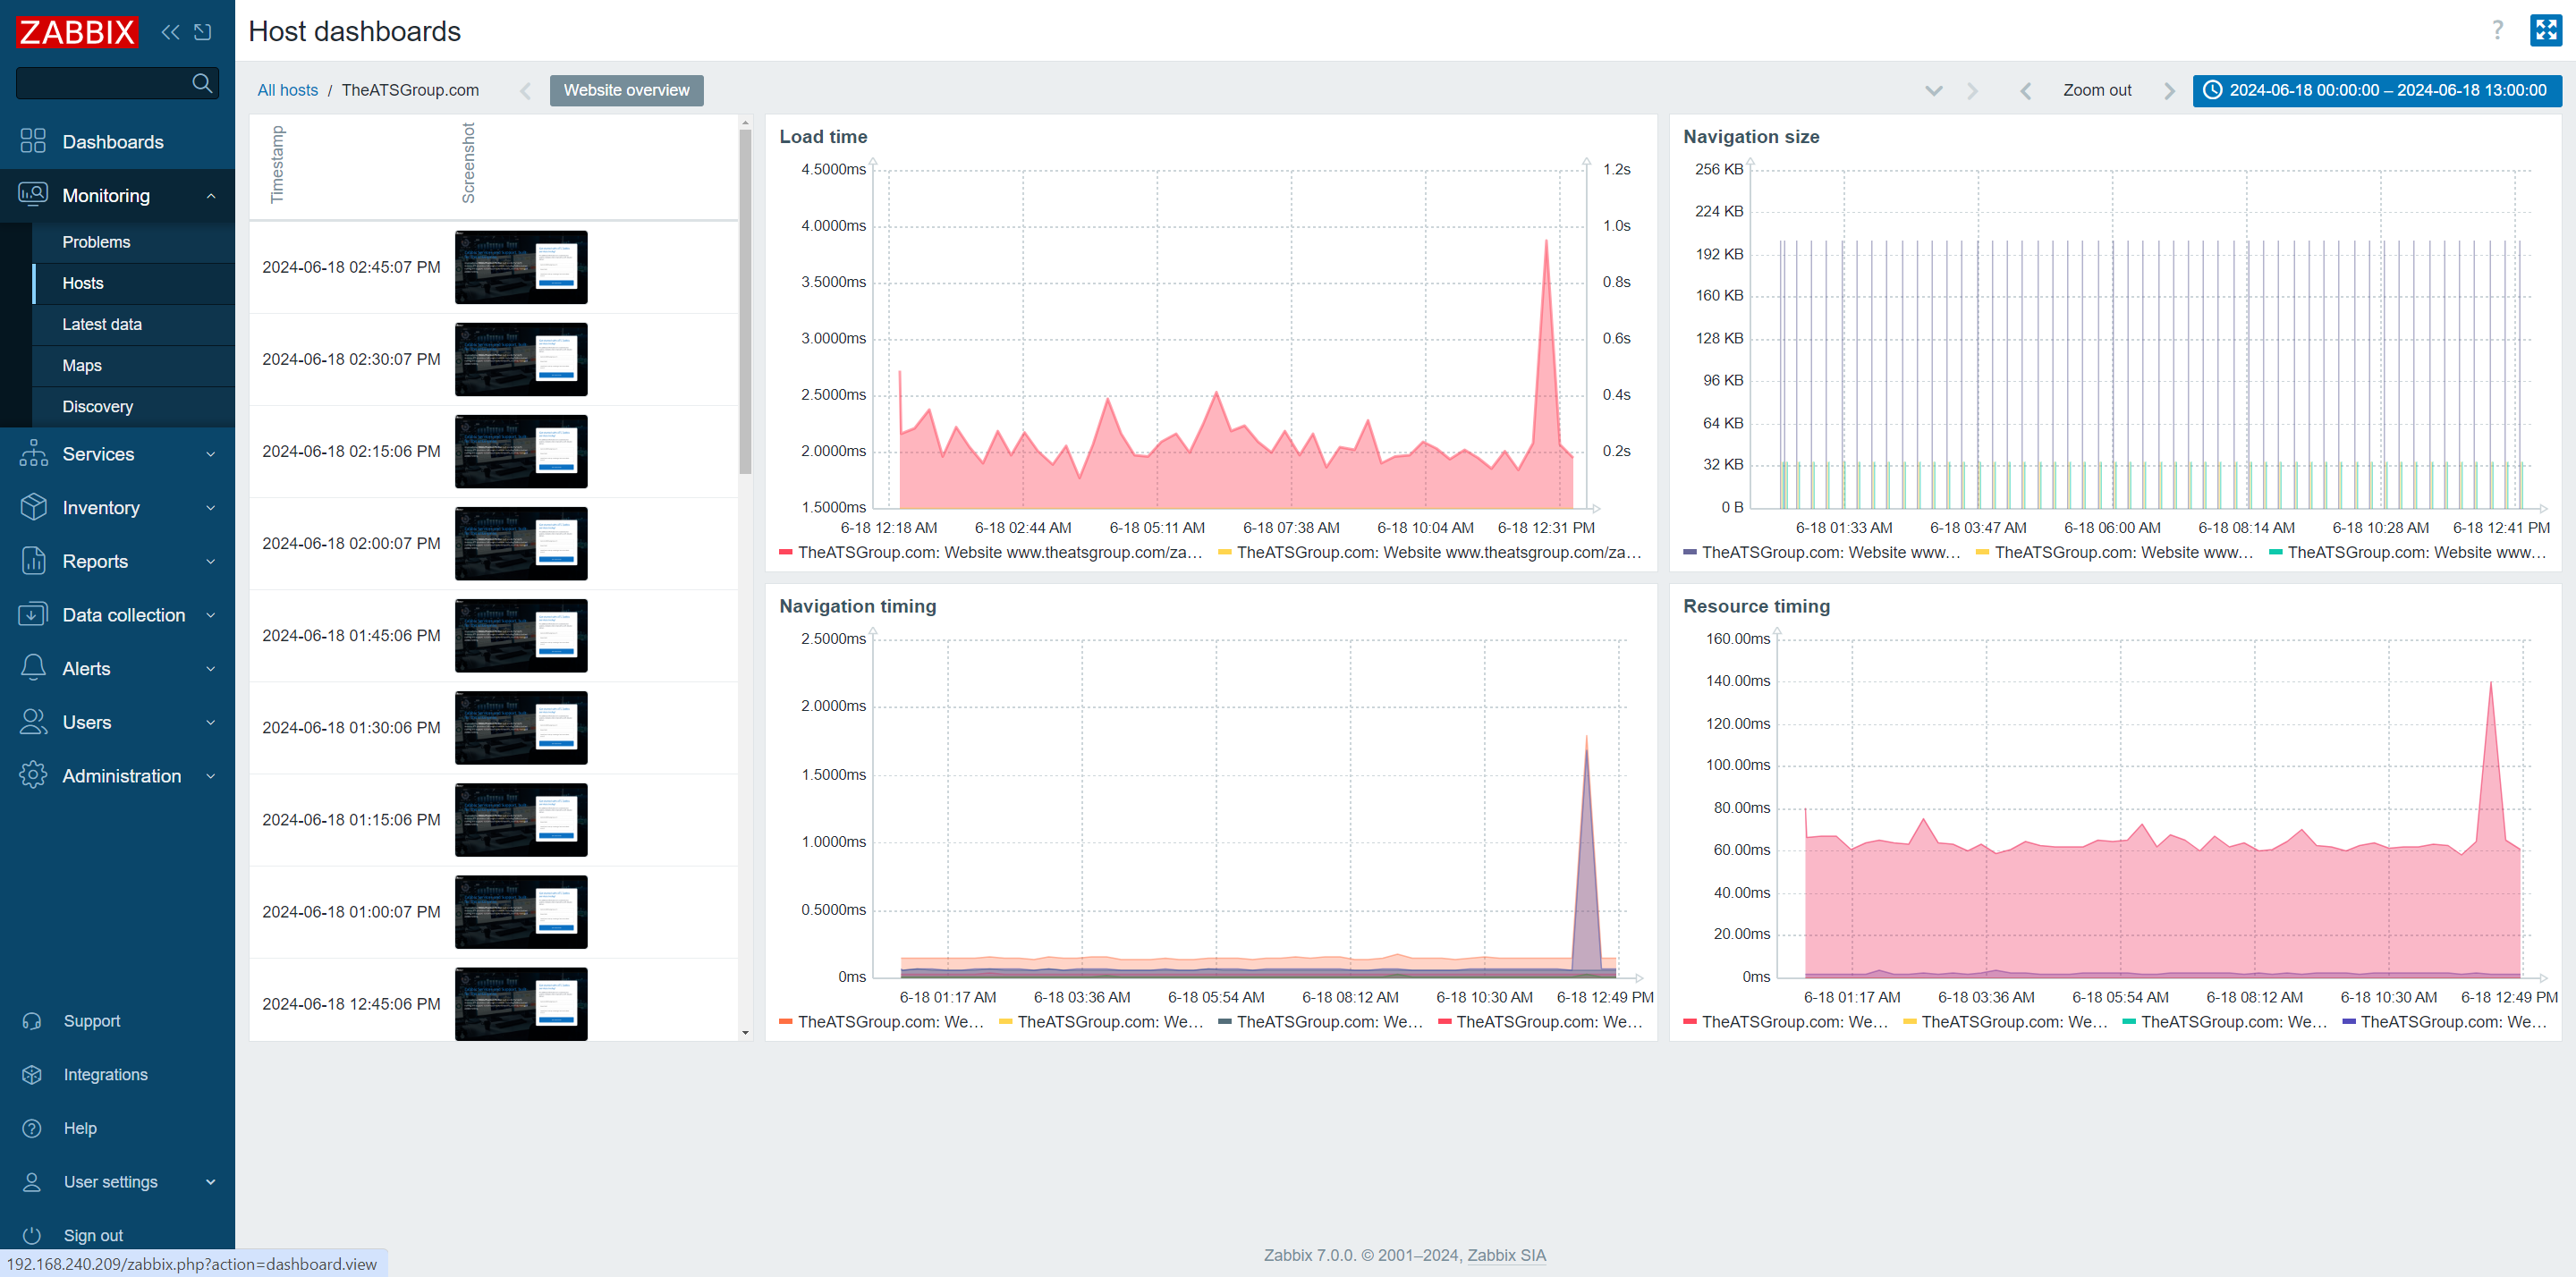
- From the sidebar, select “Monitoring” then “Hosts”
- Find the row with the new Host in the list of Hosts and select “Dashboards”
- Review all the metrics collected from the Browser Item
Simulating the End User
The original script contains three functions: “setParams,” “getOptions,” and “getPerformance.”
“setParams” loads the parameters set from the Zabbix frontend into the script, “getOptions” determines the browser the script runs from and prepares the Browser object, and “getPerformance” uses the Browser object to simulate the user and collect metrics.
“getPerformance” is where edits are made to test the Contact Us system.
To simulate an end user filling out the contact form, the following code is added between “browser.navigate(url);” and “browser.getResult”:
getPerformance() {
  // ... Previous code
  browser.navigate(url);

  /* FILL OUT THE FORM */
  // Find the email input field by its ID and fill it out
  var emailInput = browser.findElement(
    "xpath",
    "//input[@id='email-a5e24908-36c3-45a7-8d00-6c870abb02d7']"
  );
  if (emailInput === null) {
    throw Error("cannot find email input field");
  }
  emailInput.sendKeys("example@example.com");

  // Find the name input field by its ID and fill it out
  var nameInput = browser.findElement(
    "xpath",
    "//input[@id='firstname-a5e24908-36c3-45a7-8d00-6c870abb02d7']"
  );
  if (nameInput === null) {
    throw Error("cannot find name input field");
  }
  nameInput.sendKeys("John Doe");

  // Find the message textarea by its ID and fill it out
  var messageTextarea = browser.findElement(
    "xpath",
    "//textarea[@id='message-a5e24908-36c3-45a7-8d00-6c870abb02d7']"
  );
  if (messageTextarea === null) {
    throw Error("cannot find message textarea");
  }
  messageTextarea.sendKeys(
    "I would love to set up a meeting to learn more about Zabbix!"
  );

  // Find the submit button and click it
  var submitButton = browser.findElement("xpath", "//input[@type='submit']");
  if (submitButton === null) {
    throw Error("cannot find submit button");
  }
  // To submit the form, submitButton.click() would be called here
     browser.collectPerfEntries();
  // Remaining function ...//
}
Three input fields are required for the contact form, each of which is identified and populated above.
Once filled, a screenshot of the window is taken as proof and added to the resulting data sent to the Zabbix database. To verify the edits made to the script were successful in simulating the end can be found in the screenshots included in the Host’s dashboard.
Conclusion
With the introduction of Browser Item in the 7.0 LTS release, Zabbix empowers administrators to proactively monitor and maintain the health of their web-based systems, preventing potential issues and ensuring a seamless user experience. As organizations continue to rely heavily on web-based applications, the Browser Item proves to be an indispensable tool in the Zabbix monitoring arsenal, enabling businesses to stay ahead of the curve and deliver reliable, high-performing services to their customers.
As North America’s leading Zabbix partner, we offer unparalleled expertise in Zabbix training, professional services, and fully managed Zabbix hosting.
Our team provides comprehensive Zabbix training designed to equip your team with the skills needed to master Zabbix 7.0 LTS, ensuring you can fully utilize its powerful new features. Whether you are upgrading from a previous version or deploying Zabbix for the first time, our experienced professionals will guide you through a seamless transition, minimizing downtime and maximizing efficiency.
Our professional services include custom integration, implementation, and ongoing support tailored to meet the unique needs of your organization. We specialize in optimizing Zabbix environments for enhanced performance and scalability, ensuring you get the most out of your monitoring solutions. With our help, you can achieve 100% availability with Zabbix high availability and proxy load balancing and benefit from the latest advancements in data collection and visualization.
Partner with us to unlock the full potential of Zabbix 7.0 LTS and take your enterprise monitoring to the next level.
Contact ATS today to learn more about our services and how we can support your Zabbix journey.